Taxi and Wage Growth 2012 2015 2022
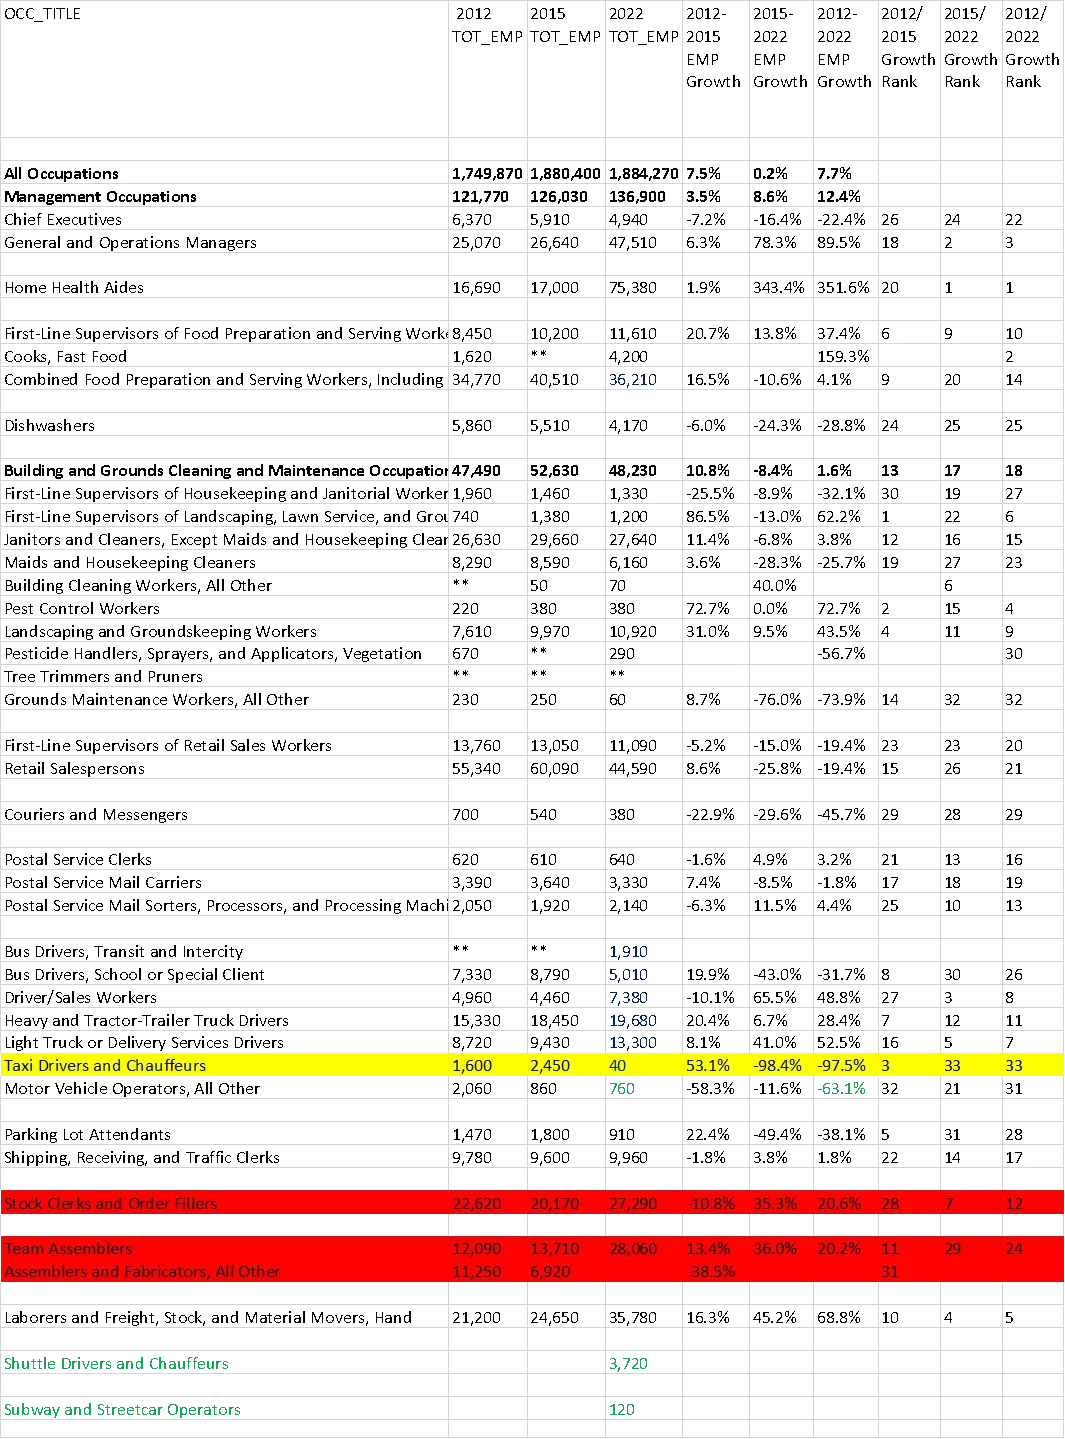
Total Employment 2012-2022 by Occupation

Entry Level Employment Growth 2012 2015 2022
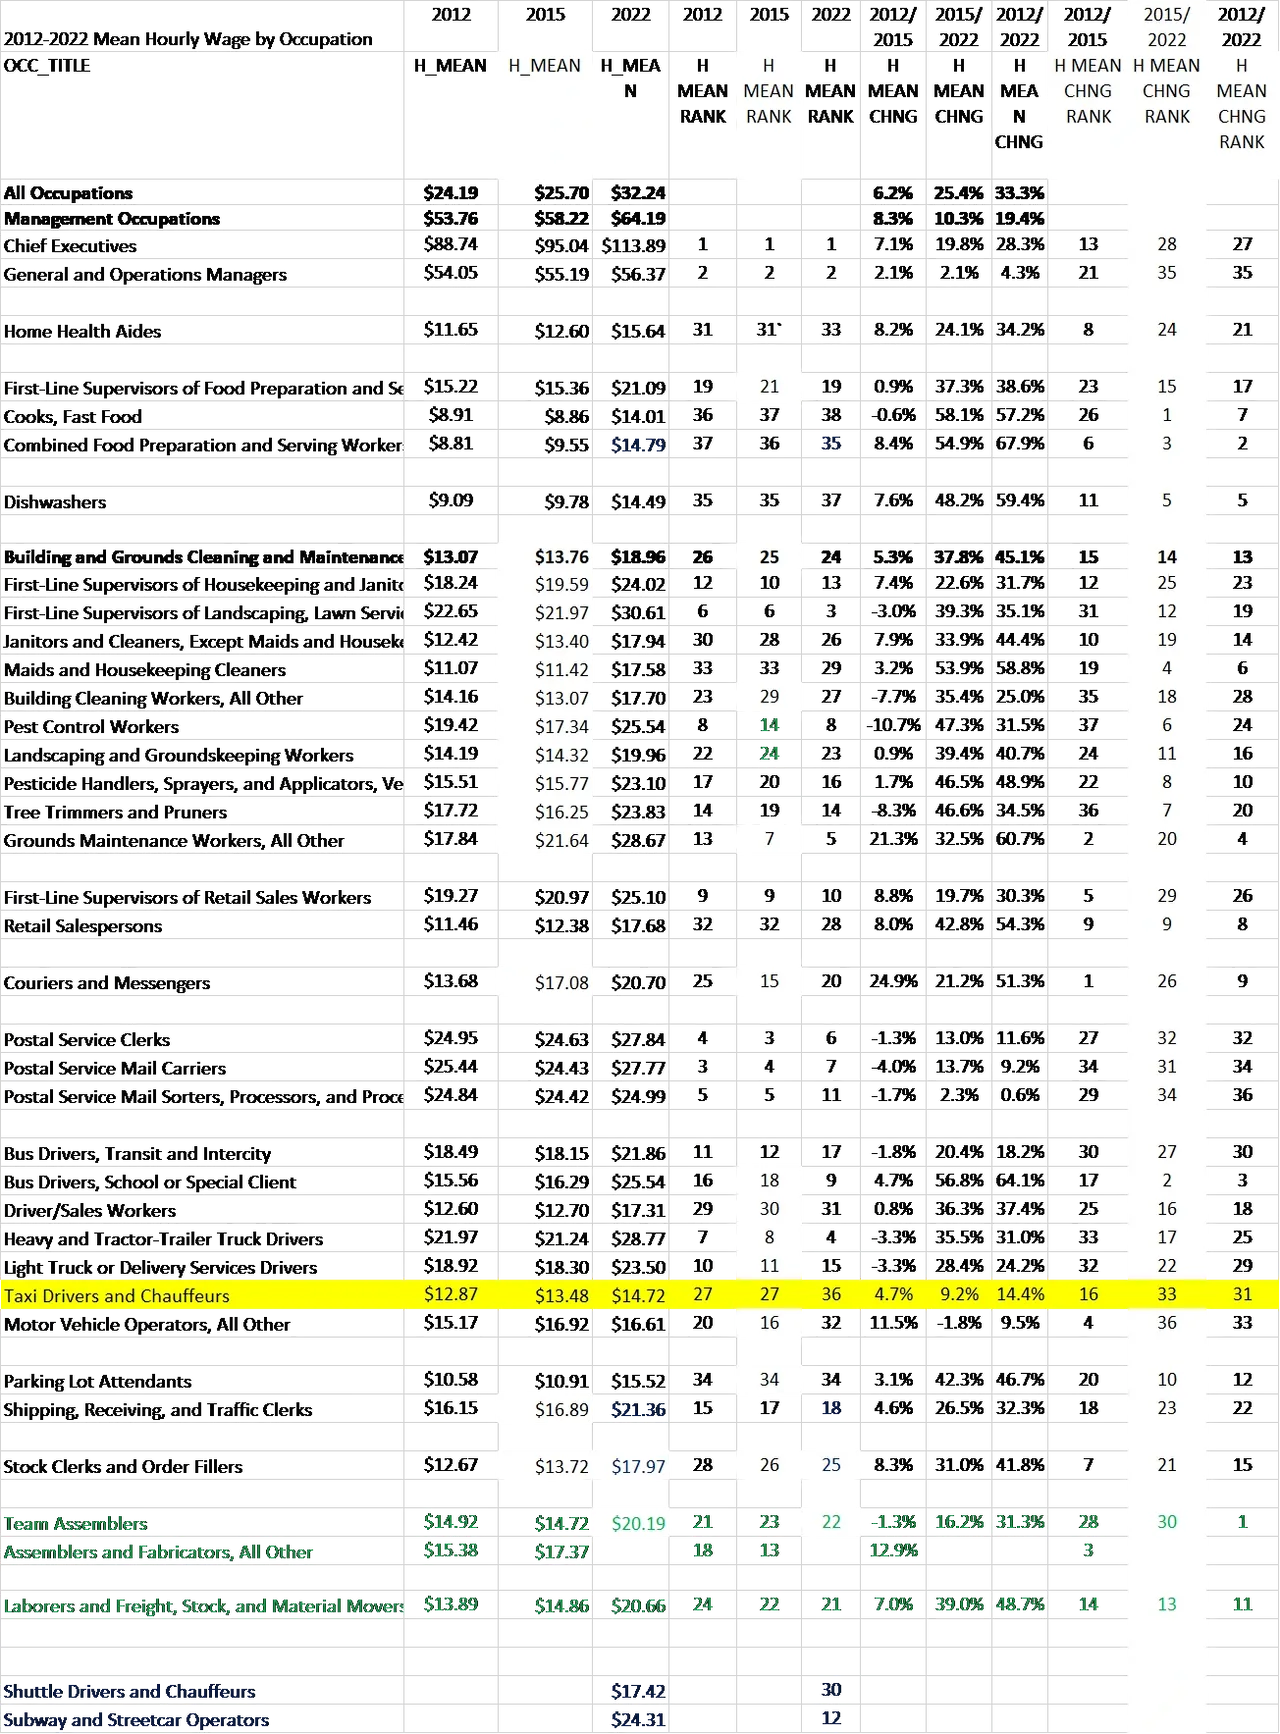
2012-2022 Mean Hourly Wage by Occupation

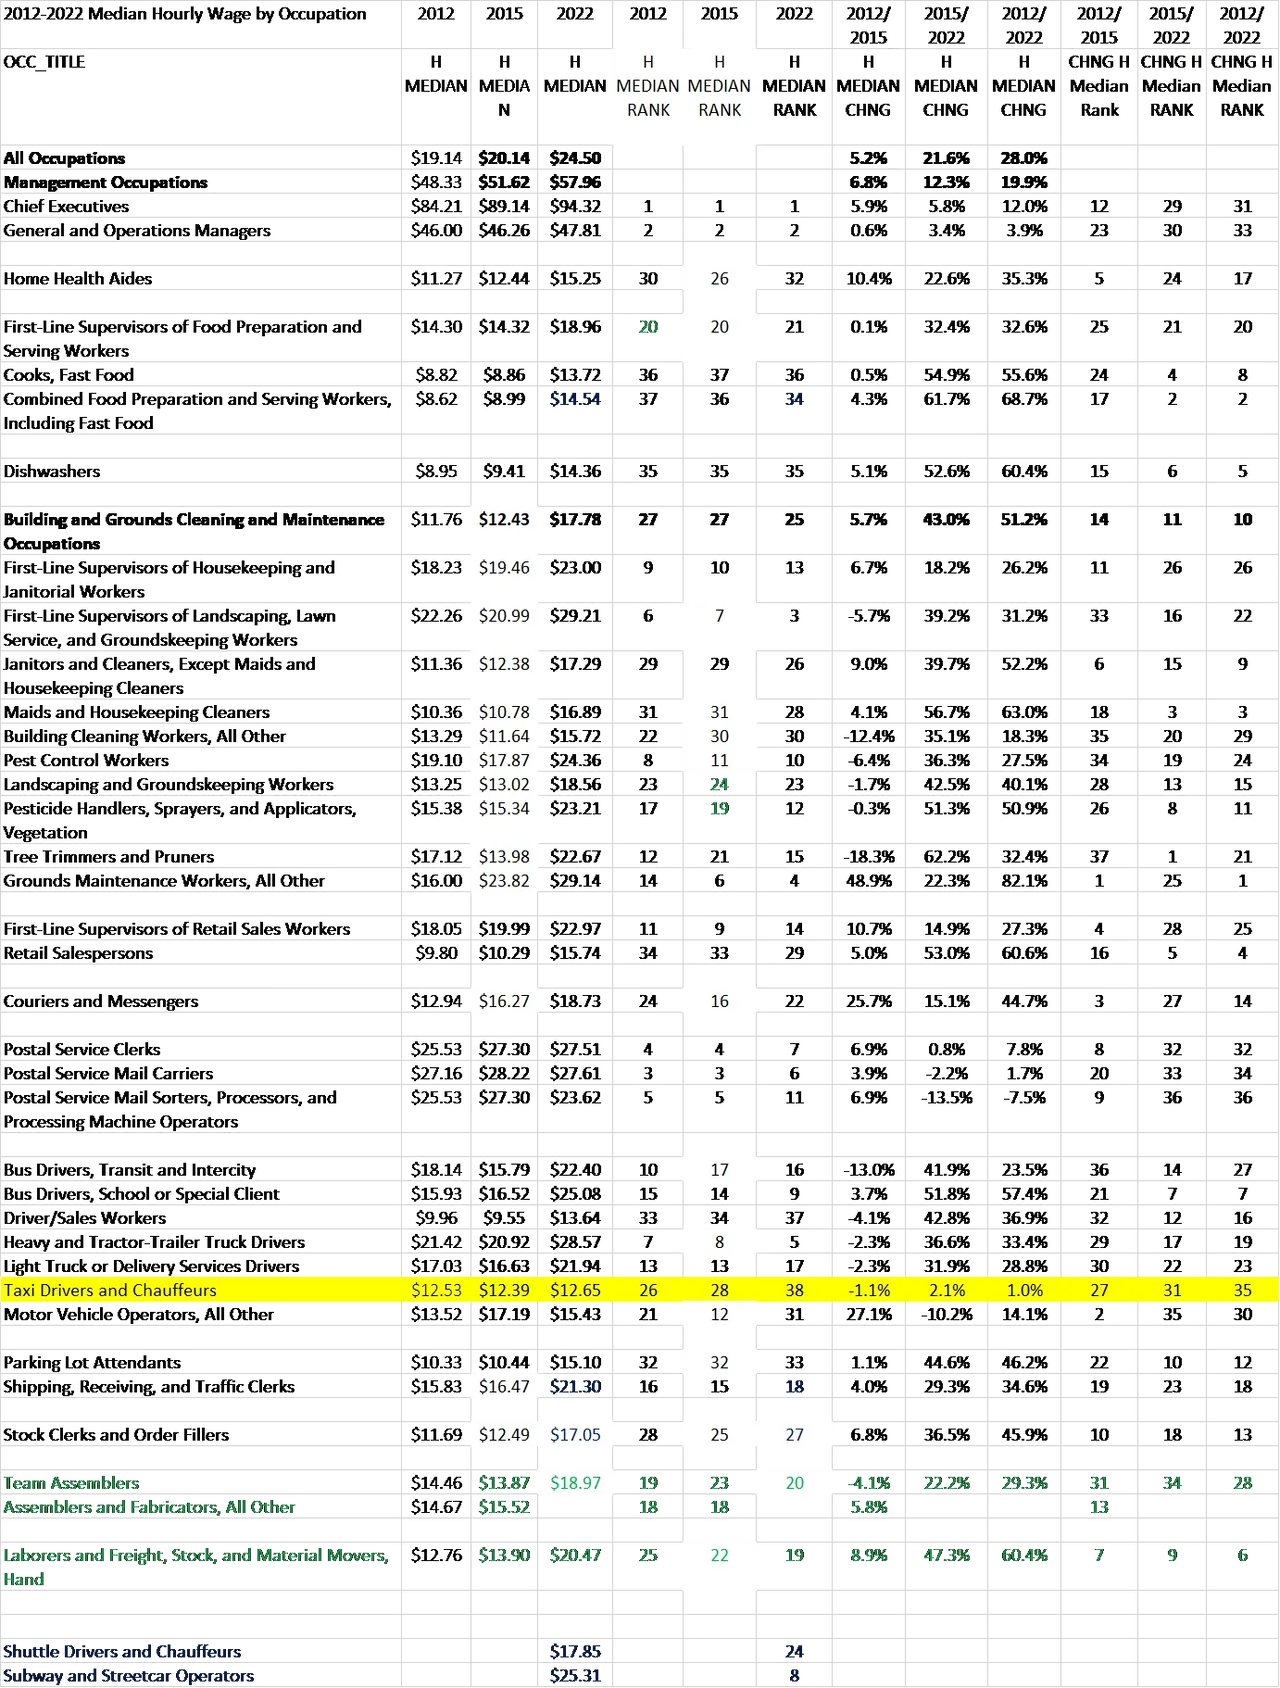
2012-2022 Median Hourly Wage by Occupation

Data Set and Reasoning
This is an examination of Entry Level Employment in the Bloomington/Mpls/St. Paul Metro area for the years 2012, 2015 and 2022. October 2012 is when Uber made its entrance to the Metro Area and 2022 is the most recent year for which data is available. The data used is from the Bureau of Labor Statistics Databases for each year.
For the study, Overall employment, CEO, General and Operations Managers and All Management Occupations were profiled to give perspective and then Food preparation/Fast Food Workers and their First line Supervisors were included as were Dishwashers.
The Building and Grounds Cleaning and Maintenance Occupations were included.
Retail Salespersons and First line Supervisors were included to manifest the potential for upward mobility in these occupations.
Couriers and Messengers and Postal Workers were included as they have an overlap of driving skill and are alternative positions for Taxi drivers/TNC drivers.
The transportation sector with the exception of pilots was included and for the years 2012 and 2015 Taxi Drivers and Chauffeurs were but were separated in 2022 with Chauffeurs being combined with shuttle drivers.
Parking lot attendants were included as they present an entry level position suitable for someone with little English.
Stock Clerks and Order Fillers, Team Assemblers, Assemblers and Fabricators, Laborers Freight, Stock and Material Movers and Handlers were also included and had category changes in 2022 and were impacted by Amazon opening its first warehouse center in October of 2015 in Shakopee.
Subway and Streetcar Operators were added as a category in 2022 and were included. Although small in number of employees, the 2022, $25.31 median hourly wage represents what the government thinks transportation workers should be paid. Likewise, city bus drivers saw median wages of $18.14 in 2012, $15.79 in 2015 and $22.40 in 2022 why as Taxi drivers and Chauffeurs in 2012 and 2015 and then Taxi drivers in 2022 saw the median wage virtually unchanged hovering at $12.50 per hour.
Findings
There is no doubt about it, the Taxi Driver position was the most adversely impacted in terms of both employment and wage growth of approximately 25 entry level positions and corresponding first line supervisor positions. The number of Taxi drivers and Chauffeurs in the Bloomington/Mpls/St. Paul Metro Area increased considerably between 2012-2015 from 1,600 to 2450 and then down to 40 Taxi drivers in 2022. It is very rare to see an industry contract so much and so quickly. In 2022- Shuttle drivers and Chauffeurs were combined together as a new category- shuttle drivers were likely categorized as Motor Vehicle Operators, all others, explaining part of the decline but never-the-less the fall to only 40 Taxi drivers is dramatic- and as one who does not use TNCs, finding a Taxi to take to the airport is somewhat difficult in the suburbs.
Subway and Streetcar Operators were added as a category in 2022 and were included. Although small in number of employees, the 2022, $25.31 median hourly wage represents what the government thinks transportation workers should be paid. Likewise, city bus drivers saw median wages of $18.14 in 2012, $15.79 in 2015 and $22.40 in 2022 why as Taxi drivers and Chauffeurs in 2012 and 2015 and then Taxi drivers in 2022 saw the median wage virtually unchanged hovering at $12.50 per hour and a mean wage increasing slightly from 2015 to 2022 from $13.48 to $14.72 for the remaining 40 workers, down from 2,450 making it by far the most adversely impacted industry from 2015-2022.
Unlike other alternate entry level fields, the Retail, the Buildings and Grounds Cleaning and Maintenance Occupations, and the Home Health Aids Professions have all seen wage growth from 2015-2022 and the Retail and the Buildings and Grounds Cleaning and Maintenance Occupations have a path of upward mobility with wage growth upon becoming a first line supervisor.
The Buildings and Grounds Cleaning and Maintenance Occupations janitors and maids positions saw total employee numbers contract between 2015-2022 as mean hourly wages increased from $11.42 and $13.40 to $17.58 and $17.94 for maids and janitors respectively and first line supervisors making $24.02 per hour in 2022 up from a mean of $19.59 in 2015.
The retail field has contracted from 60,090 employees in 2015 down to only 44,590 in 2022. Mean hourly wages have, however increased substantially to $17.68 in 2022 from $12.38 in 2015 and first line supervisors’ wages up from a mean of $20.97 in 2015 to a mean of $25.10 in 2022.
The number of Home Health Aides has increased over 340% from 2015 to 2022 from 17,000 workers in the field to over 75,000- likely as a result of 24% mean wage increases from 2015-2022 going from $12.60 to $15.64.
The number of postal employees has remained fairly constant with mean hourly wages for carriers and clerks increasing over 10% from 2015-2022 rising to over $27 per hour with mean hourly wages for sorters and processors staying stagnant at about $25 per hour.
For some perspective, employment growth overall was up 0.2% from 2012 to 2022 and up 7.5% from 2015 to 2022 with mean hourly wages rising from $24.19 in 2012 to $25.70 in 2015 to $32.24 in 2022 or an overall growth of 33% 2012- 2022. Management Occupations, which includes CEOs grew from 121,770 employees in 2012 to 136,900 in 2022 up 7.7%. Median Wages for Management Occupations grew 19.9% from 2012-2022 rising from $48.33 per hour to $57.36 per hour.
2012 Situation Taxi Industry and Wage Reporting
Mike Hicks’ March 23 2012 article “Untangling Twin Cities Taxis” for Streets MN provides some perspective and states that for a time Minneapolis limited the number of Taxis to 400 and for 2012 the number was 500. Taxis that were not licensed in in given area could drop off fares in that area but not pick up fares from that area and Mr. Hicks concluded that having Taxis licensed by the Metropolitan Council would make sense- some sort of coordinated effort is in line with what is done with Los Angeles and its neighboring cities. Los Angeles is also a “sprawl” city, like Minneapolis. The article states that the minimum fares in areas are often pegged at $5 and per-mile rates of up to $2.20 in St. Paul and $2.75 in Minneapolis were the norm plus extra fees for waiting (up to $24 per hour) or traveling from the airport- where $6.75 is on the meter before the taxi even starts moving. Tipping was customary at 10-15% of the fare. Pre-negoitiating a fare payment was possible with some drivers but Saint Paul had a minimum rate of $6.00 per hour- though you would be hard pressed to find a driver willing to drive for that rate.
A separate article by Beth Hopkins 01/06/2012 “Who works for minimum wage or less in Minnesota?” for MINNPOST stated that in 2012, under Minnesota law, certain employers could pay just $5.25 per hour and that a childless adult needs slightly more than $12 per hour to eke out a living and two adults working to support two kids must each earn $14 an hour. At that time, the median Taxi wage was $12.53 per hour for the Metro Area.
2024 Living Wage Calculation for Minneapolis-St. Paul-Bloomington, MN
According to MIT’s the Living Wage Calculator for Mpls/St. Paul, “The living wage shown is the hourly rate that an individual in a household must earn to support themselves and/or their family, working full-time, or 2080 hours per year. The tables provide living wage estimates for individuals and households with one or two working adults and zero to three children. In households with two working adults, all hourly values reflect what one working adult requires to earn to meet their families’ basic needs, assuming the other adult also earns the same.
The poverty wage and state minimum wage are for reference purposes. Poverty wage estimates come from the Department of Health and Human Services’ Poverty Guidelines for 2024 and have been converted from an annual value to an hourly wage for ease of comparison. The state minimum wage data is sourced from the Labor Law Center and includes the minimum wage in a given state as of January of that year. Updated on February 14, 2024. “ For 1 adult, no children the Living Wage is $22.49, the Poverty wage is $7.24 and the minimum wage is $10.85. Typical transportation spending for a single person is almost $10,000 year, and the living wage for 1 earner and 1 child is over $41.00 per hour. Many of the entry level position mean and median wages fall short but the Taxi wage is even more stubborn and has barely changed since 2012 at which time it was near the livable wage at the time.
